What Are Carbon Emissions and Their Types?
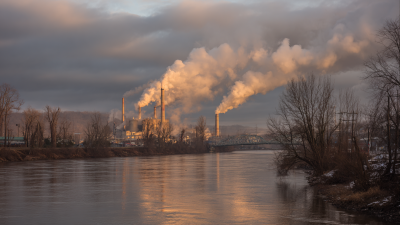
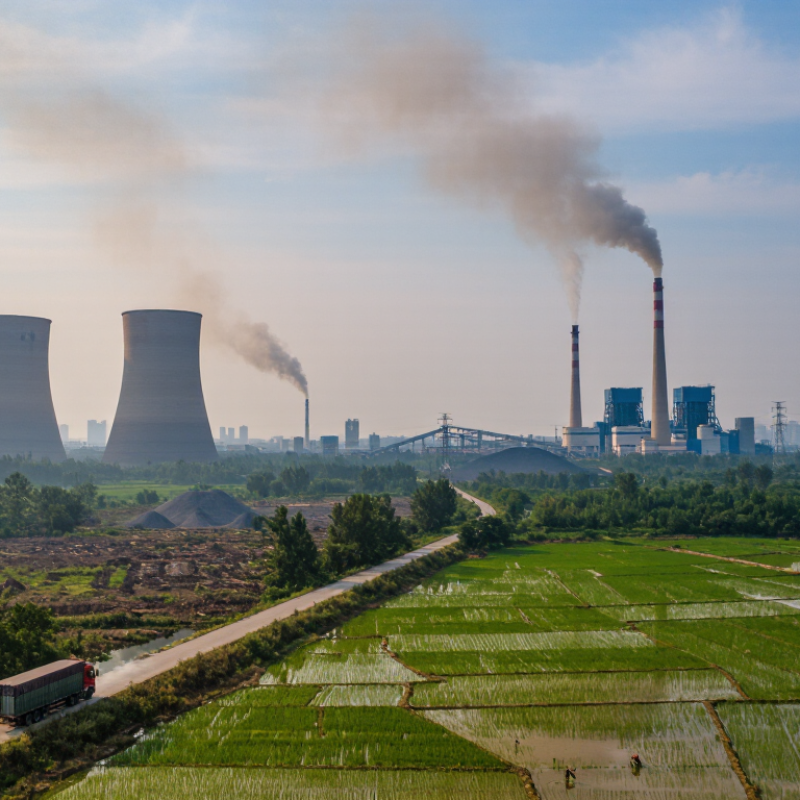
Carbon emissions are often pictured as dark exhaust rising from a factory chimney. The full picture is broader. They include carbon dioxide released by burning coal, oil, and gas, as well as emissions linked to deforestation and some industrial processes. Other heat-trapping gases matter too. Methane, nitrous oxide, and fluorinated gases differ in strength and lifetime, so climate reporting often converts them into carbon dioxide equivalent, or CO2e.
The phrase emissions carbon may appear in searches, but understanding the subject requires more than counting smokestacks. Emissions can be direct, such as fuel burned in a company boiler, or indirect, such as electricity used to light an office. Their sources vary by sector, location, and activity. A delivery truck, a rice field, and a cement kiln leave different emissions profiles. Measurement also has limits; estimates depend on data quality and boundaries. That uncertainty deserves attention, not concealment.
Climate scientist Katharine Hayhoe has said, “The most important thing you can do to fight climate change is talk about it.” Clear language helps make that conversation useful. This guide explains what carbon emissions are, how major gas types differ, and where they come from. It also introduces common ways emissions are classified and measured. The categories are practical, not perfect. Real supply chains can blur neat boundaries, and reported figures may change as better evidence emerges. That is worth remembering.
Carbon Emissions in CO₂e: The IPCC Estimates 59 Gt in 2019
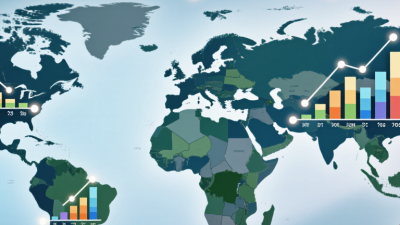
In 2019, global human-caused greenhouse gas emissions reached about 59 ± 6.6 gigatonnes of carbon dioxide equivalent (GtCO₂e), according to the IPCC. This estimate includes more than carbon dioxide. It also covers methane, nitrous oxide, and fluorinated gases, converted into a shared unit based on their warming effects. One gigatonne is one billion tonnes. A vast amount. Yet the figure is not a measure of visible smoke or pollution alone.
CO₂e helps researchers compare gases that behave differently in the atmosphere. Carbon dioxide can remain for centuries, while methane has stronger warming effects per tonne over shorter periods. The comparison depends on the chosen time horizon, often 100 years, so the method matters. The 59 Gt estimate is a global annual total, not a count of CO₂ alone. Energy, industry, transport, agriculture, and land-use change all contribute. Their shares vary, and estimates can shift with data and methods. That uncertainty deserves attention. A single global figure is useful, but it cannot show every local source with equal clarity.
Gas Types: CO₂, Methane, Nitrous Oxide, and F-Gases in IPCC Inventories
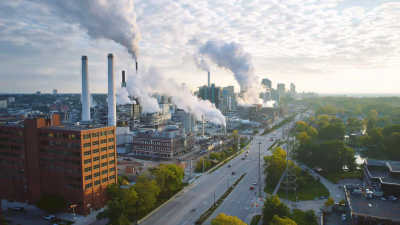
Carbon emissions are often discussed as if they were one gas. IPCC inventories track several, because each behaves differently in the atmosphere. Carbon dioxide, or CO₂, is released by burning coal, oil, and gas, as well as cement production and land-use change. It can remain in the atmosphere for a very long time. A power station’s exhaust is one visible source, but emissions also occur far from the smokestack.
Methane comes from sources such as livestock digestion, landfills, and leaks in fossil-fuel systems. It stays in the atmosphere for less time than CO₂, but traps much more heat over a given period. Nitrous oxide is linked to fertilized soils, manure management, and some industrial processes. A farm field may release it invisibly, making measurement difficult. Small amounts matter. Their climate effect is not small.
Fluorinated gases, or F-gases, include HFCs, PFCs, sulfur hexafluoride, and nitrogen trifluoride. They can come from refrigeration, foam production, or electrical equipment, depending on the gas. Some persist for centuries and have very high warming potential. Inventories commonly convert different gases into carbon dioxide equivalents using global warming potentials. The chosen time horizon affects comparisons, so one figure cannot tell the whole story. Inventory boundaries and estimates also vary; that uncertainty deserves attention, not dismissal.
What Are Carbon Emissions and Their Types? — Gas Types: CO₂, Methane, Nitrous Oxide, and F-Gases in IPCC Inventories
How to read the values: Global warming potentials (GWP) compare the warming effect of a pulse of a gas with that of the same mass of CO₂ over 100 years. Values shown are illustrative IPCC Sixth Assessment Report estimates; reported totals in CO₂-equivalent depend on the GWP metric and inventory rules being used.
Source Types: Energy Supply Caused 34% of 2019 Emissions (IPCC)
Energy supply accounted for about 34% of global greenhouse gas emissions in 2019, according to the IPCC. That share includes emissions from producing electricity and heat, as well as extracting and processing fuels. It is a large slice of the total. Not just smokestacks.
A coal-fired power station releases carbon dioxide as it generates electricity. Gas production can also release methane through leaks, while fuel processing uses energy of its own. These steps connect the power reaching a home to emissions far beyond the plug. A lit kitchen at night has a long supply chain behind it.
The 34% figure describes a sector, not one single source or gas. It also depends on how activities are grouped in emissions accounting. For example, electricity generation is counted under energy supply, while emissions from a car using fuel fall under transport. The boundary can feel unintuitive. And percentages alone do not show which local choices matter most; that requires looking at how electricity and fuels are produced in a specific place.
Scope Types: The GHG Protocol Defines Scopes 1, 2, and 3
The GHG Protocol classifies a company’s greenhouse gas emissions into three scopes. Scope 1 covers direct emissions from sources it owns or controls, such as fuel burned in an on-site boiler. Scope 2 covers emissions from purchased electricity, heating, cooling, or steam. Scope 3 includes other value-chain emissions, from materials and shipping to product use and disposal. A delivery truck may fall under Scope 1 if company-owned, but under Scope 3 if operated by a supplier.
Scope 3 can be difficult to measure because data often comes from suppliers and estimates. Still, it can dominate a company’s footprint. CDP’s 2021 Supply Chain report estimated that companies’ supply-chain emissions averaged 11.4 times their direct operational emissions. That figure reflects the companies covered by the analysis; it is not a universal ratio. Scope 2 figures also depend on whether organizations use location-based or market-based accounting. The boundary can feel messy, and estimates deserve scrutiny.
Tips: Start with fuel bills and electricity records. Then map key suppliers and transport routes. Note assumptions beside every estimate; imperfect data is more useful when its limits are clear.
Net Emissions: IPCC Estimates 6.6 Gt of Land-Use CO₂ in 2019
What Are Carbon Emissions and Their Types?
Carbon emissions are greenhouse gases released into the atmosphere, often measured as carbon dioxide equivalent. They come from energy use, transport, industry, agriculture, and changes in land use. Cutting a forest can release stored carbon from trees and soil. Regrowth can absorb some CO₂, but recovery takes time. The balance matters.
The subtitle’s figure needs careful reading: IPCC estimates put land-use-related CO₂ emissions at about 6.6 gigatonnes in 2019. Net emissions account for emissions minus removals, such as carbon absorbed by growing vegetation. Results depend on how land changes are measured and which carbon pools are counted. The accounting is not perfectly tidy, and uncertainty remains. Still, the figure shows that land use can affect the climate at a very large scale.
Tips: When comparing figures, check whether they describe gross or net emissions, and note the year and measurement scope. Look for land-use changes behind the number: forest clearing, drained peat, or regrowth. A single total can hide very different local causes.
 Skip to content