Reducing supply-chain emissions starts with seeing where they actually occur. For many businesses, the largest impacts sit beyond their own buildings—in purchased materials, supplier operations, freight, and product use. A steel component may carry emissions from mining and processing; a carton adds paper, energy, and transport. The details vary by product, so broad assumptions can point teams in the wrong direction.
A useful carbon reduction plan begins with a practical emissions inventory and clear data boundaries. Review purchasing records, shipment distances, transport modes, fuel use, and available supplier information. Then identify hotspots and check the numbers with suppliers where possible. Estimates are often necessary, especially when smaller partners lack detailed reporting. That is not a reason to pretend the figures are exact.
From there, companies can test focused changes: buy lower-emission materials, improve production efficiency, consolidate loads, shift suitable freight to rail, or reduce excess packaging. Track results against a consistent baseline, and document assumptions when data is incomplete. A fuller truck is not automatically a better choice if it creates delays or extra handling. Trade-offs matter.
Progress may be uneven. Suppliers have different capabilities, and a cheaper option can sometimes increase emissions elsewhere. This guide explores ways to set priorities, engage partners, and measure improvements without treating estimates as certainty. The work is ongoing, and some answers will need revision.
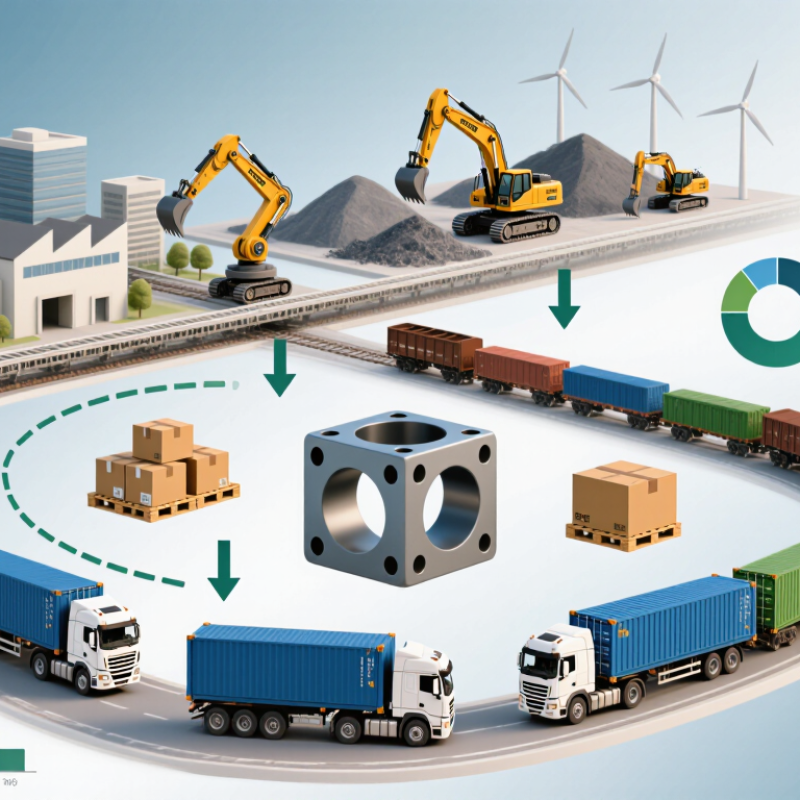
Defining the supply chain emissions scope means deciding which activities and suppliers your inventory will include. Start with your organization’s operational boundary, then map the goods and services that move through each stage. Include purchased materials, manufacturing, transport, warehousing, product use, and disposal where relevant. A shipment’s emissions can begin long before it reaches your loading dock.
Separate direct fuel use and purchased energy from other value-chain emissions. These categories help teams see what they control and where supplier data is needed. Record the boundary, reporting period, assumptions, and exclusions. For example, note whether transport estimates cover inbound deliveries only or also customer shipments. Use actual fuel or energy records when available; otherwise, document the method and data quality. The boundary will not be perfect at first. That is a reason to improve it, not to hide uncertainty.
Tips: Sketch the product journey on a whiteboard. Mark each handoff, then ask who owns the activity and what evidence exists. Prioritize high-volume materials and freight lanes before chasing tiny data gaps. Keep estimates clearly labeled, review them annually, and avoid counting the same transport leg twice. A simple, consistent scope is more useful than a precise-looking number built on unclear assumptions.

A useful reduction plan starts with a credible baseline, not a target chosen for its appeal. Map the supply chain from purchased materials through manufacturing, transport, storage, and product use where relevant. Record greenhouse gas emissions in carbon dioxide equivalent, with clear boundaries and a stated baseline year. Keep direct fuel use separate from purchased electricity and supplier-related emissions. This makes later comparisons less confusing.
Gather activity data before applying emissions factors. Ask facilities for monthly electricity bills, fuel records, refrigerant service logs, and production volumes. For freight, capture distance, shipment weight, transport mode, and empty-return assumptions. For materials, request quantities and supplier-specific emissions data when available. Note sources, units, dates, and estimation methods in one ledger. Small inconsistencies matter. A tonne and a short ton are not interchangeable.
Where supplier data is missing, use a recognized, geographically appropriate emissions factor and label the estimate plainly. Do not present modeled figures as measured facts. Check totals against invoices and operational records, then have another person review the calculations. In practice, some gaps remain. Document uncertainty ranges and improve the weakest data first. Preserve the original method so next year’s comparison remains fair, even when better records change the numbers.
Reducing supply-chain emissions starts with finding where they actually occur. CDP’s 2023 Supply Chain report found that suppliers’ disclosed emissions averaged 11.4 times the reporting companies’ direct operational emissions in 2022. Treat this as a warning, not a universal ratio: the figure reflects disclosed data and varies by industry. Look beyond office energy. A factory’s material inputs, a truck’s fuel use, and refrigerated storage can each reveal a larger hotspot.
Use the GHG Protocol’s 15 Scope 3 categories to organize the inventory. Record tonnes of CO2e, the supplier or activity, and the data source. Prioritize high-emission materials, freight routes, and purchased energy; compare them with procurement and production records. Spend-based estimates can fill gaps, but they are rough proxies. They may hide meaningful differences between suppliers. Ask key suppliers for activity data, such as fuel consumed or material quantities. Expect gaps.
Set a baseline year and measurable targets for the largest sources. The Science Based Targets initiative’s guidance gives near-term targets a five-to-ten-year horizon, allowing progress to be tracked against a defined period. Specify who owns each action, such as changing a freight mode or reducing material waste. Review results annually and update estimates when better data arrives. Targets can look precise before the underlying data is. Say so, and keep improving the measurement.
Identify high-impact sources and set reduction targets
What this means: Industry, energy supply, and agriculture, forestry, and other land use account for the largest shares of global greenhouse gas emissions. Start by measuring emissions across your suppliers and purchased goods, then prioritize the biggest hotspots and set measurable reduction targets.
Global greenhouse gas emissions by sector, 2019. Percentages are rounded. Source: IPCC Sixth Assessment Report, Working Group III, Summary for Policymakers (2022).
How to Reduce Carbon Emissions in Your Supply Chain?
Implement Emission-Reduction Measures Across the Supply Chain
Supply-chain emissions can dwarf a company’s own operational footprint. CDP’s 2021 Global Supply Chain Report estimated that suppliers’ emissions averaged 11.4 times buyers’ direct operational emissions. The figure is not universal, but it shows why action must reach beyond company facilities. Start by mapping purchased materials, manufacturing, and freight, then establish a measured emissions baseline. The GHG Protocol’s Scope 3 Standard offers a framework for categorizing these indirect sources.
Turn the baseline into practical procurement requirements. Ask suppliers for energy and emissions data, and prioritize improvements with high-impact partners. Support projects such as switching factory boilers to lower-carbon energy, reducing scrap, and using recycled material where product quality allows. Review delivery routes and shipment sizes; a half-empty truck is a visible sign of wasted capacity. Targets matter, but so do investment and technical support. Smaller suppliers may lack both, and a rushed deadline can produce poor data rather than real reductions. Progress needs checking, not just promises.
Tips: Track a few consistent indicators, such as emissions per unit, renewable electricity share, and freight emissions per shipment. Revisit them quarterly. If a number looks too neat, ask how it was measured.
| Supply Chain Area | Emission-Reduction Measure | Relevant GHG Protocol Scope or Category | Performance Indicator | How to Measure | Useful Data Sources |
|---|---|---|---|---|---|
| Purchased materials and components | Prioritize lower-emission materials, recycled content, and suppliers that provide product-level emissions data. | Scope 3, Category 1: Purchased goods and services | Emissions per unit of material purchased; share of spend covered by supplier-specific data | Multiply material quantities by suitable emission factors, or use verified supplier product-footprint data. Track recycled content by mass. | Purchase records, bills of materials, supplier declarations, product carbon footprints, and recognized life-cycle databases |
| Supplier operations | Work with suppliers to improve energy efficiency, electrify suitable processes, and use renewable electricity where available. | Primarily Scope 3, Category 1; supplier fuel use and purchased electricity are generally in the supplier’s Scope 1 and Scope 2 inventories | Supplier emissions per unit produced; energy use per unit; renewable electricity share | Collect annual fuel and electricity data, production volumes, and the method used to substantiate renewable electricity claims. | Supplier energy bills, meter records, emissions inventories, and renewable electricity documentation |
| Inbound and outbound freight | Improve route planning and vehicle utilization; avoid unnecessary air freight; consider lower-emission transport modes where service requirements allow. | Scope 3, Category 4: Upstream transportation and distribution; Category 9: Downstream transportation and distribution | Transport emissions per tonne-kilometre or shipment; freight mode mix; vehicle load factor | Combine shipment mass, distance, transport mode, and carrier-specific data or appropriate mode-specific emission factors. | Bills of lading, carrier reports, transport-management systems, shipment weights, and route records |
| Packaging | Reduce unnecessary packaging, increase reusable or recyclable formats where appropriate, and select materials with lower life-cycle impacts. | Scope 3, Category 1 for purchased packaging; Category 12 may apply to end-of-life treatment of packaging associated with sold products | Packaging mass per unit shipped; recycled content; reuse rate; packaging waste by material | Record packaging material weights and quantities, then track changes against a consistent product or shipment unit. | Packaging specifications, procurement records, warehouse data, and waste-service records |
| Warehousing and distribution centers | Improve building energy performance, maintain refrigeration equipment, and assess electrification and renewable electricity options. | Scope 1 and Scope 2 for owned or controlled sites; Scope 3 categories may apply to third-party logistics services | Energy use per square metre or unit handled; refrigerant losses; site emissions | Track electricity, fuel, refrigerant top-ups, floor area, and throughput for each facility. | Utility bills, building-management systems, maintenance logs, refrigerant records, and logistics-provider data |
| Product design and use | Design products for durability, repair, reuse, and efficient operation; assess life-cycle impacts before changing materials or components. | Scope 3, Category 11: Use of sold products; other relevant categories depend on product and design choices | Use-phase emissions per product over its expected life; repairability or service-life indicators | Estimate use-phase energy or fuel consumption using documented usage assumptions, product specifications, and applicable emission factors. | Engineering specifications, product testing, customer-use studies, and life-cycle assessment records |
| Waste and circularity | Prevent production scrap, reuse materials where feasible, and sort waste to support appropriate recycling or recovery routes. | Scope 3, Category 5: Waste generated in operations; Category 12 may apply to end-of-life treatment of sold products | Waste generated per unit produced; waste by treatment route; material recovery rate | Record waste mass by material and treatment method, using consistent boundaries and avoiding double counting. | Waste-hauler records, facility logs, production data, and recycling or recovery documentation |
| Supplier engagement and governance | Set clear data requirements, engage high-impact suppliers, and review progress using consistent calculation methods and reporting boundaries. | Supports measurement and reduction across relevant Scope 3 categories | Share of relevant suppliers reporting emissions; share of emissions based on supplier-specific data; actions completed | Maintain a supplier reporting register and document data quality, estimation methods, reporting periods, and verification status. | Supplier questionnaires, procurement systems, emissions inventories, and assurance or verification records |
Scope and category references follow the GHG Protocol Corporate Value Chain (Scope 3) Standard. Select emission factors and calculation methods that match the activity, geography, reporting period, and organizational boundary; document assumptions and data quality.
A reduction plan needs regular measurement, not a polished dashboard that sits untouched. Track fuel use, electricity, shipment distances, and purchased materials using consistent methods. Compare each month with a clear baseline, and record changes in data sources or calculation assumptions. Small gaps matter.
Look at both total emissions and emissions per unit shipped. Intensity can improve while total emissions rise, especially when order volumes grow. Review supplier data alongside invoices and shipment records; estimates are useful, but label them clearly. Keep the evidence. A simple data log can show who supplied each figure and when it was checked.
Set quarterly reviews with procurement, logistics, and operations teams. If a route change cuts distance but increases warehouse energy, examine the full effect before calling it a win. Assign one person to each action, with a deadline and a measurable target. Our first dashboard might miss a supplier’s fuel surcharge or an unusual delivery pattern. That is a reason to revisit the method, not hide the mismatch. When progress stalls, test a smaller change, such as consolidating compatible shipments, then measure the result over several weeks.