How to Reduce Carbon Emissions in Your Supply Chain
A product’s carbon footprint is shaped long before it reaches a customer. Raw materials, factory energy, packaging, and transport all contribute. For many businesses, the largest impacts sit with suppliers, where direct control is limited and data can be inconsistent. Reducing carbon emissions in a supply chain therefore starts with visibility, not a quick promise. Companies need to map key suppliers, identify major emission sources, and establish a baseline using documented activity data. Useful details might include electricity use at a production site, the weight of a shipment, or the distance traveled by truck. Small records matter.
The work becomes more credible when teams set clear boundaries and use consistent methods, such as the Greenhouse Gas Protocol’s value-chain guidance. They can then prioritize actions with measurable potential: improving factory energy efficiency, choosing lower-carbon materials, reducing unnecessary packaging, or adjusting freight plans. Progress should be checked against the baseline and reported with assumptions clearly stated. Some supplier data will be estimated. That is not ideal. It is a reason to improve measurement, not to hide uncertainty. Procurement teams also need realistic timelines and ongoing conversations with suppliers, especially smaller firms that may lack specialist staff. There is no single fix, and a cheaper option is not always the lower-carbon one. A practical plan makes trade-offs visible, assigns responsibility, and revisits results as better evidence becomes available.
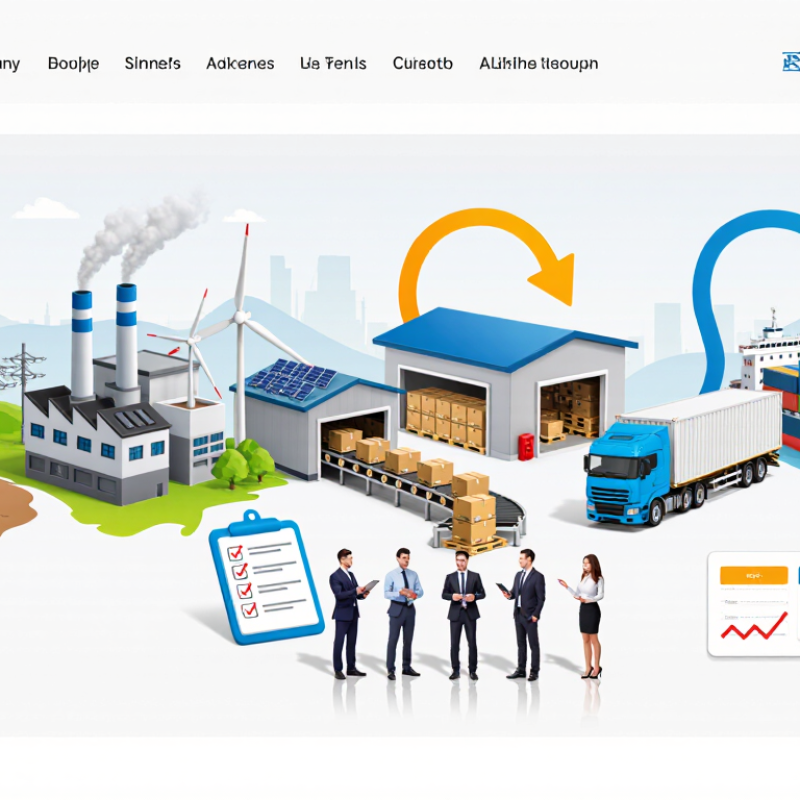
Map Emissions Across Your Supply Chain
To reduce carbon emissions in your supply chain, map where they occur before choosing solutions. A useful map follows materials and services from extraction to delivery: steel in a component, electricity at a supplier’s factory, and fuel used to move cartons between warehouses. The GHG Protocol’s Scope 3 Standard groups value-chain emissions into 15 categories, giving teams a consistent way to organize the work.
CDP’s 2020 Global Supply Chain Report found that participating companies’ supply-chain emissions averaged 11.4 times their direct operational emissions. That figure is not a universal benchmark, but it shows why looking beyond owned facilities matters.
Start with purchasing records, product bills of materials, freight routes, and supplier locations. Mark which figures come from measured energy use and which are estimates based on spending. Then identify high-emission materials, suppliers, and transport lanes for better data collection. A spreadsheet can be a practical start. It will also have gaps. Treat the map as a working model, not a precise account of every tonne.
Tips: Request supplier-specific energy and emissions data where possible. Record each figure’s year, boundary, and method, so comparisons are fair. If data is missing, state the assumption instead of disguising uncertainty. Revisit the map annually; supplier networks and purchasing patterns change.
Measure a Baseline for Supply Chain Carbon
A useful supply-chain carbon baseline begins with a clear boundary: which sites, products, suppliers, and reporting year are included? The GHG Protocol’s Corporate Value Chain (Scope 3) Standard provides a framework for identifying relevant upstream and downstream activities. This matters because CDP’s 2020 Global Supply Chain Report found that companies’ supply-chain emissions averaged 11.4 times their operational emissions. The overlooked footprint can be substantial.
Start with activity data where possible: tonnes of material purchased, kilometres traveled, fuel used, and electricity consumed. Match each figure to an appropriate emissions factor, record its source, and flag estimates. For example, a shipment’s weight, distance, and transport mode can produce a more useful freight estimate than its cost alone. Ask major suppliers for emissions data and calculation methods; do not treat every supplier estimate as equally reliable. A baseline is not perfect. Its limitations should be visible, not hidden.
Tips: Fix the reporting year and organizational boundary before collecting data. Keep a simple record of data sources, assumptions, and gaps. Revisit estimates as better supplier information arrives. Small gaps matter.
Set Clear, Science-Aligned Reduction Targets
A supply-chain target is useful only when its boundary is clear. Start with a recent emissions inventory covering purchased materials, freight, energy, and relevant supplier activity. Record the base year, calculation methods, and data gaps. Estimates can be useful when disclosed and improved over time. Be specific.
Choose a science-aligned pathway and set a dated, measurable goal instead of promising vague progress. For example, a manufacturer might target absolute emissions cuts by 2030 against a stated base year, while tracking emissions intensity separately. Do not let intensity gains hide rising total emissions. Include Scope 1 and 2 operations, and assess the Scope 3 categories most relevant to the business. Check targets against recognized climate-science guidance, and revisit them when methods or boundaries change.
Targets become operational when teams assign owners, budgets, and milestones. Ask suppliers for practical activity data, such as fuel used per shipment or electricity consumed per production batch. Provide a clear reporting template; smaller suppliers may not have carbon specialists. Review progress regularly, but avoid treating every figure as exact. Measure, then improve. An initial baseline may be messy. Document assumptions and focus better data collection on the largest sources of emissions.
Reduce Emissions Through Supplier and Logistics Changes
Supplier and logistics decisions can outweigh changes inside a company’s own buildings. CDP’s 2021 Global Supply Chain Report found that suppliers’ emissions averaged 11.4 times buyers’ operational emissions. That makes supplier data a practical starting point. Ask major suppliers to report emissions using the GHG Protocol’s Scope 3 Standard, then focus on high-emitting materials and processes. For example, a buyer sourcing steel can compare verified emissions per tonne, not just purchase price. Set improvement targets with suppliers, and offer longer contracts where credible progress requires investment. Data will be incomplete at first. Treat estimates as estimates, and document the assumptions.
Logistics changes can cut fuel use while improving delivery planning. Consolidate partial loads, reduce empty return trips, and shift suitable freight from air to sea or rail. A shipment that cannot meet a deadline by rail should not be forced into an unrealistic plan. The International Energy Agency reported that transport produced about 8 gigatonnes of direct CO2 emissions in 2022, roughly 25% of global energy-related CO2 emissions. Freight is only part of that total, but route choices still matter. Track emissions per tonne-kilometre alongside delivery reliability, using consistent activity data. A full truck is not automatically a low-carbon truck; vehicle type, distance, and fuel all count. Supplier engagement can feel slow, and targets may expose gaps in a company’s own purchasing practices. That discomfort is useful.
How to Reduce Carbon Emissions in Your Supply Chain
Reduce emissions through supplier and logistics changes
Freight emissions vary with distance, vehicle, fuel, and load. Where delivery times allow, choosing rail or sea instead of air freight can substantially lower transport emissions. Work with suppliers to consolidate shipments and disclose transport data so you can identify practical reductions.
Values are approximate reference factors in g CO₂e per tonne-kilometre; actual results vary by route and methodology. Reference: UK Government GHG Conversion Factors for Company Reporting, conversion factors.
Track Progress and Refine Reduction Measures
A useful reduction plan starts with a clear baseline. Record fuel use, electricity consumption, shipment distances, and key materials by site and reporting period. Keep the calculation method consistent, or apparent progress may come from changed assumptions rather than lower emissions. Small details matter.
Review results every quarter. Compare total emissions with emissions per unit shipped; both measures reveal different things. A fuller truck can lower emissions per item, while rising order volumes may still push total emissions up. Check unusual changes against delivery records and utility bills. If the numbers conflict, investigate before adjusting targets.
Work with suppliers to improve activity data and identify practical changes, such as reducing empty miles or consolidating deliveries. Track each measure’s owner, start date, expected effect, and actual result. Then refine the plan when evidence shows a measure is ineffective or creates trade-offs, such as longer storage times. Some supplier estimates will remain rough. Note the uncertainty, explain the method, and improve data quality over time rather than presenting estimates as precise facts. A missed target can reveal a weak assumption, not just weak performance. Keep that possibility visible in progress reviews.
 Skip to content