
For global buyers, emissions cost is no longer a distant sustainability concern. It can appear in supplier quotations, border charges, logistics invoices, and internal risk reports. A shipment of steel, electronics, or textiles may carry hidden carbon expenses long before it reaches the warehouse. Understanding these expenses requires more than choosing the cheapest supplier. It requires reliable data, contract discipline, and practical cooperation across the supply chain.
This guide explores ten realistic ways to reduce emissions cost without weakening quality or compliance. The methods include improving supplier emissions data, comparing transport routes, consolidating shipments, and selecting lower-carbon materials. Buyers can also use lifecycle assessments, verified environmental certificates, and clear contract clauses. Each option should be checked against applicable environmental rules and recognized reporting standards. Professional advice may be necessary when calculations affect customs declarations or financial planning.
Experience shows that attractive estimates can fail under closer review. Some suppliers use different measurement boundaries. Some carbon factors remain outdated. That gap matters. A buyer may believe emissions have fallen while the actual footprint has only moved elsewhere. Therefore, this discussion treats reduction as a measurable business process, not a marketing promise. Readers will find practical checkpoints, cost questions, and areas requiring independent verification. The strongest savings usually come from several modest changes, repeated across purchasing decisions. No single solution works everywhere. Real progress may begin with a simple invoice, a verified supplier record, or one less urgent shipment.
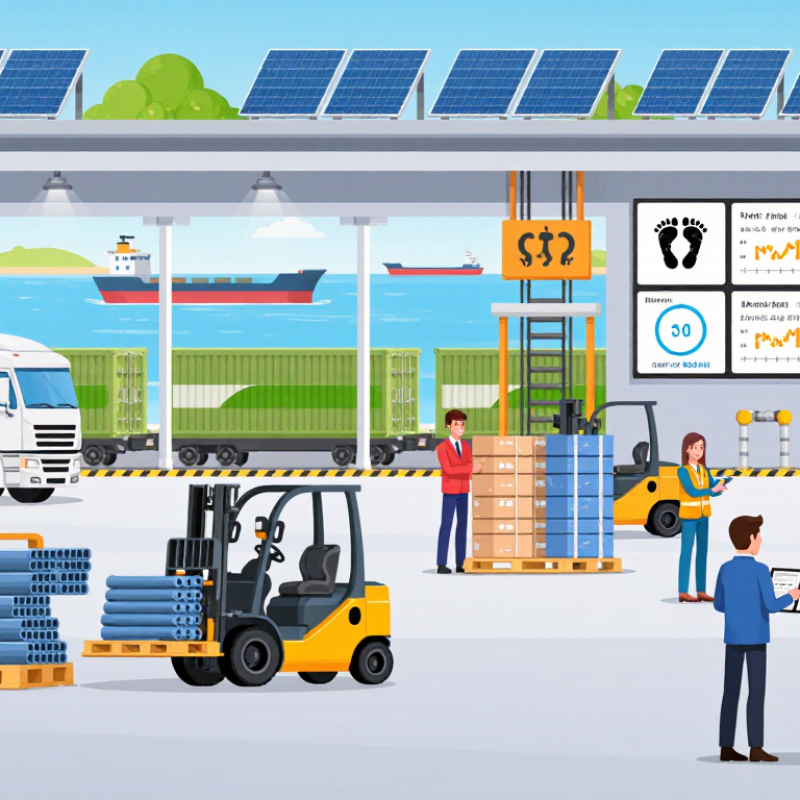
Global buyers face emissions costs from more than carbon taxes. The main drivers include fuel use, electricity intensity, transport distance, material choice, and supplier data quality. The World Bank’s State and Trends of Carbon Pricing 2024 reports 75 carbon-pricing instruments worldwide. They cover about 24% of global greenhouse-gas emissions. Prices still differ sharply by market.
Scope 3 exposure can be larger than expected. CDP’s 2023 Global Supply Chain Report found that supply-chain emissions average 11.4 times higher than operational emissions. The IEA reported energy-related CO2 emissions of about 37.4 gigatonnes in 2023. Buyers can reduce costs by mapping suppliers, measuring product footprints, improving factory efficiency, using renewable power, choosing lower-carbon materials, consolidating shipments, increasing truck and container utilization, shifting suitable freight to rail or sea, reducing packaging, and adding emissions clauses to contracts. These actions also improve the evidence needed for border carbon reporting. Poor data remains a serious weakness.
Tips: Request primary activity data. Check calculation boundaries. Use the GHG Protocol. Compare supplier figures with invoices, meter readings, and transport records. Pilot changes with one product lane first. That approach is slower, but often more credible. Do not assume a “green” certificate removes every emissions liability. Contract language can also fail when carbon prices change, so review it annually.

Accurate emissions measurement is the foundation for lowering costs across global procurement. The GHG Protocol Product Standard recommends assessing a product’s full life cycle, from raw materials to disposal. This prevents buyers from focusing only on factory energy while missing transport, packaging, and purchased components. CDP’s 2020 Global Supply Chain Report estimated that supply chain emissions are, on average, 5.5 times higher than direct operational emissions. The hidden cost is often substantial.
Start with product-level carbon footprints. Collect supplier activity data, such as kilograms of aluminum, kilowatt-hours of electricity, fuel use, and shipping distance. Apply verified regional emission factors, and record each factor’s source and year. Separate primary supplier data from industry averages. That distinction matters. A polished spreadsheet can still contain weak assumptions. Our first estimate may be wrong, but transparent uncertainty supports better decisions. Independent assurance can then test boundaries, allocation methods, and missing data.
Tips: Map the top ten emission-intensive inputs. Request monthly energy records, not guesses. Compare supplier data with invoices and production volumes. Use the GHG Protocol Scope 3 Standard for category consistency. Recalculate footprints when materials, routes, or suppliers change. Keep a clear audit trail. Do not reward a low number until its evidence is strong. The Carbon Disclosure Project also stresses supplier engagement and data quality, because purchasing decisions improve when emissions are measured beside price, volume, and delivery performance.
Global buyers can reduce emissions costs by choosing suppliers with lower, measured carbon footprints. This decision affects purchase prices, freight emissions, reporting quality, and future compliance risk. Request product-level data, not broad corporate promises. Ask for energy sources, production volumes, transport routes, and calculation boundaries. A supplier using renewable electricity may still ship materials across oceans. Distance matters. Compare delivered emissions, not factory emissions alone. Practical procurement reviews often reveal gaps quickly. They also show when a cheaper quote hides expensive carbon work.
Select materials with recycled content, longer service lives, or lower-temperature processing. However, recycled content is not automatically better. Its quality, traceability, and transport requirements need checking. Require dated evidence, independent verification where practical, and clear allocation methods for shared facilities. A short pilot order can test consistency before a global contract. Measure twice. Record supplier changes, batch origins, and shipment weights. These details support credible emissions estimates and help teams challenge optimistic claims.
Price carbon into supplier evaluations alongside cost, quality, and delivery reliability. A modest premium may reduce exposure to volatile energy prices and future reporting demands. Still, buyers should avoid treating one score as a final answer. The first shortlist may contain hidden weaknesses, especially when data is self-reported. Recheck figures during quarterly reviews and invite suppliers to improve their plans. Some will need technical support rather than immediate rejection. This approach can lower emissions while preserving supply resilience, although it requires patience, skilled review, and occasional uncomfortable purchasing decisions.
In procurement reviews, logistics often hides avoidable emissions costs. Start by measuring each route with shipment weight, volume, distance, and transport mode. Measure the route. Compare air, ocean, rail, and road options before approving delivery schedules. A slightly slower service may reduce emissions and freight charges significantly.
Consolidate compatible orders into fewer shipments whenever inventory timing allows. Avoid sending half-empty containers or urgent cartons caused by weak forecasts. Shipment planning should match production dates, warehouse capacity, and seasonal demand. Small errors matter. Use regional distribution points when they shorten final-mile distances. However, extra storage can create new costs, so verify the full journey.
Packaging deserves the same attention. Replace oversized cartons with right-sized designs, while protecting products from damage. Test recycled or lighter materials, but check compression strength and moisture resistance. One damaged shipment can erase the expected environmental savings.
Record packaging weight for every product group. This supports more reliable emissions estimates and exposes unusual increases. I have seen teams trust standard carton sizes for years without checking actual void space. That habit is convenient, but rarely efficient. Review supplier packing instructions, pallet patterns, and loading photos quarterly. Data may be incomplete. Keep improving it rather than pretending every calculation is precise.
Top 10 Ways to Reduce Emissions Cost for Global Buyers
Use Renewable Energy, Offsets, and Continuous Emissions Tracking
Global buyers can cut emissions costs through ten practical levers. These include renewable electricity, energy efficiency, electrification, cleaner logistics, supplier engagement, low-carbon materials, product redesign, verified offsets, data controls, and regular reviews.
Renewable power should lead the plan. On-site solar, utility contracts, and credible energy certificates can reduce exposure to volatile fossil-fuel prices. The International Energy Agency reported that global clean-energy investment could reach 2 trillion dollars in 2024. Buyers should still check contract terms, grid location, and hourly matching. Cheap certificates may not create new renewable capacity.
Offsets can address difficult residual emissions, but they should not replace direct reductions. Use projects with additionality evidence, transparent monitoring, and permanent climate benefits. The World Bank reported that carbon pricing revenues exceeded 100 billion dollars in 2023. This signals rising financial pressure. Yet offset quality remains uneven.
Tips: Track Scope 1, 2, and 3 emissions monthly. Use the GHG Protocol for consistent boundaries. Connect invoices, shipment records, meter readings, and supplier declarations. A dashboard can still lie when supplier data is estimated. Our own assumptions often look precise before verification. Set data-quality grades, audit high-risk categories, and recalculate baselines after major sourcing changes. Continuous tracking reveals small leaks, such as idle refrigeration, empty return trips, or renewable contracts that do not match production hours.
Use Renewable Energy, Offsets, and Continuous Emissions Tracking
| # | Cost-Reduction Measure | Primary Emissions Scope | Typical Planning Potential | Cost or Investment Signal | Recommended Buyer Action | Verification Metric |
|---|---|---|---|---|---|---|
| 1 | Procure renewable electricity | Scope 2 | Up to 100% reduction in market-based electricity emissions when eligible renewable contracts or certificates match consumption | Low to medium; depends on tariff, contract term, and certificate price | Prioritize additional, time-matched, and geographically relevant renewable supply where available. | Megawatt-hours covered, certificate quality, contract duration, and market-based Scope 2 emissions |
| 2 | Improve energy efficiency | Scope 1 and Scope 2 | Commonly 5–20% lower energy use after audits, controls, maintenance, and equipment upgrades | Low to medium; many measures have short payback periods | Install submetering, optimize operating schedules, reduce compressed-air losses, and upgrade lighting and motors. | Energy intensity per unit produced, purchased, or shipped |
| 3 | Electrify suitable operations | Scope 1, with a potential increase or decrease in Scope 2 depending on the grid | Often 20–50% lower operational emissions for suitable heating, material-handling, and vehicle applications | Medium to high upfront investment; operating savings may offset capital cost | Replace fossil-fuel equipment with electric alternatives where duty cycles, infrastructure, and grid capacity allow. | Fuel displaced, electricity consumption, equipment utilization, and location-based emissions |
| 4 | Optimize freight modes and load utilization | Scope 3, Category 4 and Category 9 | Approximately 5–30% lower freight emissions through consolidation, higher load factors, and lower-carbon modes | Low; savings can result from fewer shipments, lower fuel use, and better asset utilization | Consolidate orders, increase container utilization, reduce empty miles, and shift time-flexible freight from air to sea or rail. | Grams of CO₂e per tonne-kilometre, shipment, or product unit |
| 5 | Use lower-carbon materials and packaging | Scope 3, Category 1 and Category 12 | Material-specific; reductions may come from recycled content, lightweighting, reuse, and lower-carbon production | Low to medium; material substitution can reduce both emissions and material spend | Set recycled-content, weight, reuse, and recyclability requirements in product and packaging specifications. | Kilograms of CO₂e per kilogram of material or per finished product |
| 6 | Engage suppliers with emissions targets | Scope 3, especially purchased goods and services | Potentially 5–15% improvement in supplier-related emissions where efficiency and renewable-energy projects are implemented | Low for data and training; medium for supplier improvement projects | Segment suppliers by emissions impact, require primary data, and include reduction targets in sourcing decisions. | Supplier data coverage, emissions intensity, target progress, and verified activity data |
| 7 | Apply internal carbon pricing | All relevant scopes | No direct reduction by itself; redirects capital and sourcing decisions toward lower-emissions options | Administrative; common planning prices range from approximately US$25–100 per tonne of CO₂e | Use a shadow price when comparing suppliers, facilities, transport modes, and capital projects. | Share of purchasing decisions screened and emissions avoided per investment dollar |
| 8 | Track emissions continuously | Scope 1, Scope 2, and selected Scope 3 categories | Target 100% monthly coverage of material energy and logistics activity; better visibility enables corrective action | Low to medium; depends on metering, software, data integration, and assurance requirements | Connect utility, fuel, freight, purchasing, and production data to a consistent emissions ledger. | Data completeness, data latency, emission-factor quality, and variance against targets |
| 9 | Reduce residual emissions with high-quality offsets | Residual emissions after direct reductions | One tonne of verified removal or avoidance claim per verified tonne purchased; not a substitute for operational reductions | Indicatively US$5–50+ per tonne for many avoidance projects; durable removals can cost substantially more | Use offsets only for residual emissions and require additionality, permanence, robust monitoring, and independent verification. | Verified tonnes retired, project type, vintage, registry record, and permanence risk |
| 10 | Use emissions clauses in global sourcing contracts | Scope 3 and supplier-related emissions | Improves accountability and can accelerate annual reductions when linked to supplier scorecards and corrective actions | Low administrative cost; financial impact depends on incentives and contract design | Require emissions disclosure, reduction plans, renewable-energy evidence, audit rights, and corrective-action timelines. | Contract coverage, supplier response rate, verified reductions, and performance against annual targets |
Planning ranges are indicative and vary by geography, grid intensity, technology, activity data, and contract structure. Emissions accounting should follow the GHG Protocol, use documented emission factors, and avoid double counting between renewable-energy instruments and offsets.