Skip to content

Global procurement connects factories, ports, warehouses, and customers across long distances. Each decision can increase or reduce environmental impact. A cheaper supplier may require air freight, heavy packaging, or energy-intensive production. These hidden effects often remain outside a purchasing team’s immediate view.
Practical reduction begins with reliable data. Procurement managers can map supplier emissions, transport distances, material choices, and packaging volumes. The Greenhouse Gas Protocol offers a useful structure for measuring value-chain emissions. ISO 14001-certified suppliers may also provide stronger environmental management evidence. Certification alone is not proof.
Ask precise questions. How much electricity comes from renewable sources? What percentage of packaging is recycled? Can delivery schedules support ocean or rail freight? Are emissions figures independently verified? Site visits and supplier records can reveal details that spreadsheets miss, such as unnecessary plastic film around small components.
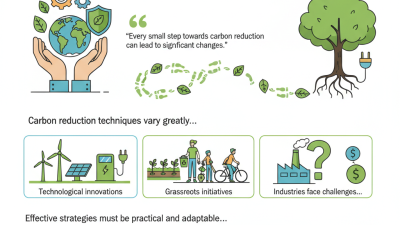
Small changes matter.
However, global procurement rarely produces perfect results. Renewable energy availability differs between regions. Lower-carbon shipping can increase delivery times. Recycled materials may have inconsistent quality or limited supply. These trade-offs require documented decisions, not attractive promises. A procurement team should compare cost, durability, service reliability, and environmental performance together.
This guide examines supplier selection, life-cycle thinking, logistics planning, packaging redesign, and responsible performance tracking. It focuses on actions that procurement professionals can apply and review over time. Progress may be uneven. That is acceptable, if the evidence is honest and the next improvement is clear.

Global procurement often looks cleaner than it really is. Office electricity and company vehicles are visible, measured, and managed. Supplier emissions are harder to see. Yet CDP data indicates that supply chain emissions can be 11.4 times higher than operational emissions. This gap changes where procurement leaders should begin.
Map Scope 3 before setting ambitious reduction targets. Start with purchased materials, transport, packaging, and supplier energy use. Request primary data where possible, such as kilograms of steel, fuel used per shipment, or renewable electricity percentages. For smaller suppliers, use verified industry averages rather than forcing false precision. The first map will be incomplete. That is acceptable.
Procurement criteria should then connect emissions with commercial decisions. A bid can include carbon intensity, recycled content, shipment distance, repairability, and reduction plans. Contract terms may require annual data updates and measurable progress. Avoid rewarding attractive estimates without evidence. One supplier may report detailed emissions, while another may appear cleaner because it reports less. That problem needs review.
Pilot the process on a high-spend category. Compare baseline emissions with price, quality, lead time, and supply risk. Ask suppliers to explain unusual changes. A sudden reduction may reflect better performance, but it may also reflect changed accounting. Document the assumptions. They will matter during audits, negotiations, and future target setting.
| Priority | GHG Protocol Scope 3 Category | Procurement-Relevant Emission Source | Typical Activity Data to Collect | Preferred Calculation Approach | Practical Reduction Lever |
|---|---|---|---|---|---|
| 1 | Purchased Goods and Services | Raw materials, components, packaging, contracted services and other purchased inputs | Mass, quantity, material type, supplier-specific emissions, purchase value and product carbon footprint | Supplier-specific or product-level data first; use hybrid or spend-based estimates for gaps | Low-carbon material specifications, recycled content, design efficiency and supplier reduction targets |
| 2 | Capital Goods | Buildings, machinery, equipment, vehicles and other assets purchased or constructed | Asset type, material quantity, embodied carbon, expected service life and purchase date | Asset-level embodied-carbon data or quantity-based emission factors | Whole-life carbon criteria, refurbishment, modular design and low-carbon construction materials |
| 3 | Fuel- and Energy-Related Activities Not included in Scope 1 or Scope 2 |
Upstream extraction, production and transport of purchased fuels and electricity | Fuel and electricity consumption, energy source, grid region and supplier energy data | Fuel-cycle and electricity life-cycle emission factors | Renewable electricity procurement, energy-efficiency requirements and supplier renewable-energy plans |
| 4 | Upstream Transportation and Distribution | Inbound freight, warehousing and distribution services purchased by the reporting organization | Shipment mass, distance, route, transport mode, load factor, fuel type and warehouse energy | Fuel-based or distance-and-mass-based calculation using mode-specific factors | Modal shift, route optimization, shipment consolidation, local sourcing and low-emission logistics |
| 5 | Waste Generated in Operations | Waste treatment and disposal services for operational waste | Waste mass by material and treatment route, including recycling, incineration and landfill | Waste-type-and-treatment-specific emission factors | Waste prevention, reusable packaging, higher-value recycling and supplier take-back programs |
| 6 | Business Travel | Air, rail, road and accommodation services purchased for business travel | Passenger distance, travel class, transport mode, hotel nights and location | Distance-based factors by transport mode and accommodation type | Virtual collaboration, rail substitution, travel policy and lower-emission accommodation criteria |
| 7 | Employee Commuting | Transportation between employees’ homes and operating locations | Employee count, commuting distance, transport mode, frequency and remote-work days | Survey-based distance and mode estimates with regional emission factors | Public-transit benefits, cycling facilities, carpooling and flexible-work arrangements |
| 8 | Upstream Leased Assets | Assets leased by the reporting organization and not already included in Scope 1 or Scope 2 | Leased floor area, energy consumption, asset type, lease period and location | Energy-use-based data or floor-area-based estimates | Green-lease clauses, energy-performance requirements and renewable-energy sourcing |
| 9–15 | Downstream Categories | Transportation and distribution, processing, use and end-of-life treatment of sold products, plus leased assets, franchises and investments | Sales volume, product use profile, distribution route, asset ownership and end-of-life pathway | Product-level, distance-based, energy-use-based or lifecycle assessment methods | Efficient product design, repairability, reuse, take-back schemes and lower-carbon customer-use scenarios |
Method note: Scope 3 categories and boundary descriptions follow the Greenhouse Gas Protocol Corporate Value Chain (Scope 3) Standard. Emissions should be reported in tonnes of carbon dioxide equivalent (tCO₂e), using consistent global-warming-potential values and transparent calculation assumptions.