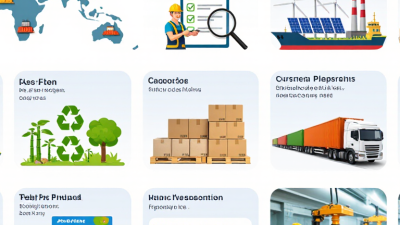
Global buyers are entering 2026 with greater pressure to measure, reduce, and report industrial emissions. A practical co2 emission reduction strategy must connect climate goals with daily purchasing decisions. It should cover energy use, transport, materials, packaging, and supplier performance. Buyers need evidence, not attractive promises.
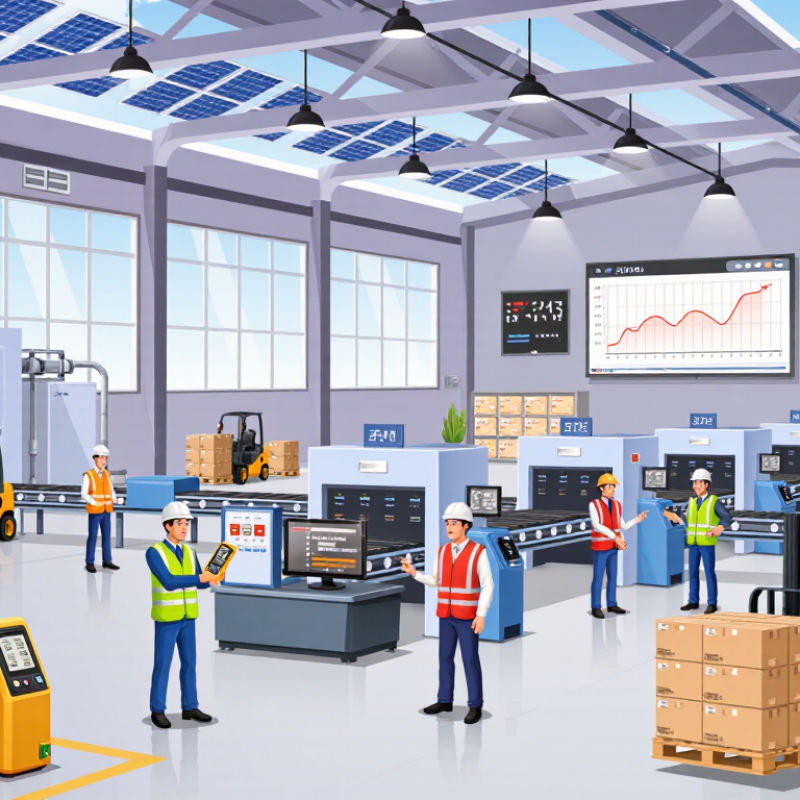
The strongest solutions often begin with an energy audit at a real facility. A factory may discover that compressed air leaks waste power overnight. Another site may reduce emissions through rooftop solar, efficient motors, heat recovery, or lower-carbon electricity contracts. These measures can produce visible results on production floors, where meters, maintenance logs, and monthly bills reveal actual progress. Small changes matter.
Yet no solution works everywhere. A technology that performs well in a sunny warehouse may disappoint in a cold, grid-dependent region. Cost, maintenance skills, local infrastructure, product quality, and worker safety require careful evaluation. Buyers should request verified emissions data, clear calculation boundaries, independent certifications, and realistic payback estimates. Supplier interviews and site visits can expose gaps that brochures hide.
This 2026 guide examines practical CO2 emission reduction solutions for global buyers, including renewable energy, energy-efficient equipment, cleaner logistics, circular materials, and credible carbon accounting. It also considers implementation risks, supply-chain transparency, and measurable return on investment. Some recommendations may remain imperfect, because emission data is often incomplete. That limitation deserves attention, not concealment. A responsible purchasing decision balances ambition with verifiable performance.
2026 Best CO2 Emission Reduction Solutions for Global Buyers
For global buyers, CO2 emission reduction solutions are purchasing decisions, not distant environmental promises. They influence supplier selection, product costs, delivery risks, and reporting quality. A practical program starts with a measured baseline. Buyers should request energy use, production volumes, transport distances, and emission factors. These details reveal weak data early. Use consistent Scope 1, Scope 2, and relevant Scope 3 definitions.
Start with efficiency. Upgrading motors, compressed-air systems, boilers, and insulation can reduce emissions before new equipment is installed. Renewable electricity may reduce operational emissions, but buyers should verify its source, time period, and accounting method. Electrification can help in suitable facilities. It may perform poorly where grids remain carbon-intensive or power supply is unstable. Evidence matters.
Look beyond the factory gate. Packaging weight, shipping mode, warehouse energy, and product durability can change the real footprint. Supplier questionnaires need records, not polished claims. Site visits, invoices, meter readings, and independent verification improve confidence. Still, global supply chains rarely provide perfect data. Some estimates will be rough. Buyers should disclose uncertainty instead of hiding it. Contracts can include reduction targets, data-sharing duties, and review dates. A pilot production line may expose maintenance problems before a costly rollout. The cheapest option is not always the lowest-risk option.

What CO2 emission reduction solutions mean for global buyers
The chart shows the estimated annual global mitigation potential of selected solutions by 2030, measured in gigatonnes of CO2-equivalent per year. For buyers, the largest opportunities generally combine renewable electricity, energy efficiency, low-carbon transport, methane reduction, and land-use measures. Actual results depend on technology performance, location, infrastructure, policy, and supply-chain conditions.
Source: IPCC AR6 WGIII, Summary for Policymakers, Figure SPM.7. Values are rounded indicative estimates synthesized from the mitigation-potential ranges reported by the IPCC; categories may overlap and should not be added as a single guaranteed total.
Carbon reduction starts with measurement, not a confident guess. Global buyers should map emissions across purchased materials, freight, energy, packaging, and product use. Use recognized greenhouse gas accounting standards and document every assumption. Keep invoices, fuel records, shipment weights, and supplier activity data in one auditable file.
Direct measurements are strongest, but estimates remain common. A supplier may report electricity use, while transport data arrives in vague distance bands. That gap matters. Calculate Scope 1, Scope 2, and relevant Scope 3 emissions in carbon dioxide equivalent. Record the method, emission factors, reporting year, and data quality. Repeat the exercise quarterly when operations change.
Do not chase the largest number automatically. Rank reduction priorities by emissions volume, cost, feasibility, and customer impact. A heavy product shipped by air may deserve urgent attention, even if factory electricity is easier to improve. Test practical options: renewable electricity, lower-carbon materials, fuller shipments, route changes, repairable design, and reduced packaging. Set a baseline and compare results against it. Targets without a baseline can sound impressive but remain difficult to trust.
Some data will be incomplete. That is normal, but it should not be hidden. Ask suppliers for evidence, check unusual changes, and review calculations with an independent specialist when decisions carry financial risk. My own measurement work has shown that small classification errors can distort priorities. Recheck them.
| Emission Source | GHG Protocol Category | Activity Data Required | Recommended Measurement Method | Calculation Formula | Typical Data Quality | Reduction Priority | Practical Reduction Solutions | Key Performance Indicator |
|---|---|---|---|---|---|---|---|---|
| Purchased electricity | Scope 2: Purchased energy | Electricity consumed by site, facility, or production line in kWh | Use utility invoices, submeters, and the applicable location-based or market-based emission factor | kWh × electricity emission factor = kg CO2e | High when meter and invoice data are available | High | Energy-efficiency upgrades, load management, renewable electricity procurement, and on-site renewable generation | kWh per unit of product; Scope 2 emissions per unit of product |
| Stationary fuel combustion | Scope 1: Direct emissions | Fuel type and quantity used in boilers, furnaces, generators, or heating equipment | Use calibrated fuel meters, purchase records, and country- or fuel-specific emission factors | Fuel quantity × fuel emission factor = kg CO2e | Medium to high, depending on metering coverage | High | Electrification, heat recovery, equipment efficiency, low-carbon fuels, and preventive maintenance | Fuel use per production hour; direct emissions per unit of output |
| Company-owned vehicles and mobile equipment | Scope 1: Direct emissions | Fuel consumed, distance travelled, vehicle type, and operating hours | Prefer fuel-card records or telematics; use distance-based estimates only when fuel data are unavailable | Fuel consumed × fuel emission factor = kg CO2e | High for fuel records; medium for distance estimates | Medium to High | Route optimization, driver training, maintenance, fleet electrification, and reduced idling | Fuel per kilometre; emissions per delivery; percentage of low-emission vehicles |
| Purchased materials and components | Scope 3, Category 1: Purchased goods and services | Mass or spend of each material, recycled content, supplier data, and product specifications | Use supplier-specific product carbon footprints where verified; otherwise use process or spend-based factors | Material quantity × cradle-to-gate emission factor = kg CO2e | Low to medium unless primary supplier data are available | Very High | Material efficiency, recycled or lower-carbon inputs, design optimization, supplier engagement, and verified product carbon data | Material emissions per unit; percentage of spend covered by primary data |
| Inbound and outbound transportation | Scope 3, Categories 4 and 9 | Weight, distance, transport mode, shipment frequency, and load factor | Use logistics records and mode-specific distance or fuel factors | Tonne-kilometres × transport emission factor = kg CO2e | Medium; high when shipment-level data are available | Medium to High | Modal shift, shipment consolidation, improved load factors, regional sourcing, and lower-emission fuels | kg CO2e per tonne-kilometre; emissions per shipment |
| Business travel and employee commuting | Scope 3, Categories 6 and 7 | Travel distance, transport mode, hotel nights, and commuting patterns | Use travel-management data, expense reports, employee surveys, and recognized emission factors | Passenger-distance or hotel nights × emission factor = kg CO2e | Medium to low when based on surveys | Medium | Virtual meetings, travel policies, rail substitution where practical, public transport, and flexible work arrangements | Travel emissions per employee; percentage of business meetings held virtually |
| Operational waste and wastewater | Scope 3, Category 5 | Waste mass by material and treatment route, including recycling, incineration, and landfill | Use waste-transfer records and treatment-specific emission factors | Waste quantity × treatment emission factor = kg CO2e | Medium when waste streams are weighed separately | Medium | Source reduction, reuse, recycling, process-yield improvement, and improved waste segregation | Waste per unit of output; recycling or reuse rate; landfill diversion rate |
| Use of sold products | Scope 3, Category 11 | Units sold, expected lifetime, operating energy or fuel use, and usage profile | Apply a life-cycle assessment using documented use-phase assumptions | Units sold × lifetime use × use-phase emission factor = kg CO2e | Medium; depends on customer-use data | Very High | Energy-efficient design, product durability, repairability, low-carbon operating modes, and user guidance | Lifetime use-phase emissions per product; energy use per operating cycle |
| End-of-life treatment of sold products | Scope 3, Category 12 | Product mass, material composition, recovery route, and expected disposal method | Use product bills of materials and region-specific end-of-life scenarios | Product mass × end-of-life emission factor = kg CO2e | Low to medium where disposal routes are uncertain | Medium | Design for disassembly, recyclable materials, take-back programs, refurbishment, and clear disposal instructions | Recovery rate; recycled content recovered; end-of-life emissions per product |
Measurement principle: quantify activity data first, apply transparent and geographically appropriate emission factors, document assumptions, and prioritize sources according to absolute emissions, reduction potential, business control, data quality, and implementation cost.
For global buyers in 2026, the greatest CO2 reductions usually come from lowering energy demand first. Efficient motors, heat recovery, insulation, and process controls can reduce emissions every operating hour. Electrifying low-temperature heat can deliver larger cuts when electricity comes from cleaner sources. However, results depend heavily on local grid intensity. A factory using coal-based electricity may gain less than its planning model predicts. Measure before investing. Review twelve months of energy bills, production data, and equipment loads.
Hard-to-abate industries need a broader technology mix. Methane leak detection can prevent powerful short-term warming emissions from escaping during oil, gas, waste, and agricultural operations. Electric vehicles can reduce fleet emissions, especially where daily routes are predictable. For cement, steel, and chemicals, renewable power, material efficiency, and carbon capture may work together. Carbon capture is not a universal answer. It requires reliable storage, monitoring, energy, and transparent verification. Some projects still depend on optimistic assumptions.
Tips: Compare technologies by verified tonnes of CO2 reduced, not headline efficiency. Request lifecycle data, maintenance records, and third-party measurement. Test one site before expanding globally. Include grid changes, equipment replacement, and worker training in the cost model. Imperfect data is common. Ignoring it is worse. Review performance quarterly, because promised reductions can weaken when production patterns change.
2026 Best CO2 Emission Reduction Solutions for Global Buyers
How Global Buyers Can Compare Costs, Quality, and Compliance
Global buyers should compare total ownership costs, not only purchase prices. Include installation, energy use, maintenance, replacement parts, freight, and disposal. A low-cost solution may consume more power after three years. That hidden expense can erase the original saving. Request measured emission reductions from comparable operating conditions. Ask for testing dates, calculation methods, and supporting records. Vague carbon claims deserve careful review.
Quality must be practical and measurable. Check material specifications, operating limits, warranty terms, service response, and spare-part availability. Request independent laboratory reports when performance affects investment decisions. A supplier with clear documentation usually reduces procurement risk. However, perfect data is rare. Local electricity sources, weather, user behavior, and transport routes can change results. A spreadsheet may look precise while missing these variables.
Tips: Build a comparison table with price, verified reduction, service life, and compliance documents. Check whether certificates match the destination market. Review factory audit records and product test reports. Ask for one realistic case study, including limitations and failed assumptions. Do not reward impressive percentages without baseline data. Small pilot projects can expose installation problems before a large purchase. Keep every claim traceable to a document or measurement.
A long-term emission reduction strategy begins with a credible baseline. Measure fuel, electricity, transport, process emissions, and major supplier activities. Use twelve months of data when possible.
Record the source, date, unit, and calculation method for every figure. Our first baseline was wrong because one meter covered two production areas. We corrected it after comparing invoices with equipment readings.
Set targets that match business growth, not only percentage reductions. Define annual milestones for energy intensity, renewable electricity, logistics emissions, and supplier engagement.
Assign an owner to each target. A shared dashboard should show monthly performance, data gaps, and delayed actions.
Keep it practical. A spreadsheet can work if controls are clear and updates are consistent.
Monitoring needs both numbers and site experience. Review unusual changes, such as a sudden winter energy spike or an empty delivery truck returning. Investigate before changing the target.
Independent verification can test calculations and strengthen buyer confidence. However, verification does not repair weak data collection.
Train staff to document maintenance, production volume, and fuel purchases at the point of use. Revisit the strategy every quarter, because equipment, suppliers, and customer requirements change.
Some actions will fail. Record why, adjust the plan, and protect the lessons.