2026 Top Strategies for Reducing Carbon in Global Sourcing

Global sourcing can move products across oceans, but its carbon footprint often begins much closer to the factory floor. It is shaped by raw materials, production energy, packaging, and transport choices. Reducing carbon therefore requires more than choosing a shorter shipping route. It means examining how goods are made, where suppliers obtain materials, and what happens before products reach a warehouse.

IPCC Chair Jim Skea has warned, “The choices and actions implemented in this decade will have impacts now and for thousands of years.” That warning gives sourcing teams a practical reason to act. They can map emissions across suppliers, request credible activity data, and compare lower-carbon materials and freight options. A shipment’s route may look efficient on paper, yet its production process could tell a different story. Details matter.

The work is rarely tidy. Supplier records may be incomplete, and estimates can hide meaningful differences between factories. Buyers should set measurable goals, check data quality, and work with suppliers on realistic improvements rather than relying on broad claims. Costs matter. So do delivery reliability and product quality. In the following strategies, we will look at practical ways to reduce sourcing emissions—from supplier engagement and material choices to logistics planning and progress tracking. No single tactic solves the problem. Better decisions, repeated across purchasing categories, can make the footprint more visible and create room for steady improvement.

2026 Top Strategies for Reducing Carbon in Global Sourcing

Understanding Carbon Emissions in Global Sourcing

Global sourcing emissions often begin far from the purchasing office. They arise when raw materials are extracted, processed, and moved, then continue through supplier production. The GHG Protocol’s Scope 3 Standard groups these impacts across categories such as purchased goods and upstream transport. CDP’s 2021 Global Supply Chain Report found that suppliers’ emissions averaged 11.4 times companies’ direct operational emissions among reporting companies. UNEP’s 2024 Global Resources Outlook estimates that resource extraction and processing account for over 60% of planet-warming emissions. Often overlooked.

A steel component may carry substantial emissions before it reaches a factory; a cotton garment’s footprint can depend on farming, dyeing, and electricity sources. Spend-based estimates help when supplier data are missing, but they can blur differences between materials and production methods. The data are rarely tidy. Supplier-specific figures, product boundaries, and allocation methods should be checked before comparing quotes. A low-carbon shipping route may reduce transport emissions, yet leave the larger material footprint unchanged. This is where sourcing teams need to examine both the item and its origin, rather than relying on one headline carbon number. Some gaps will remain, and recording them honestly is more useful than treating estimates as precise measurements.

Mapping Emissions Across the Supply Chain

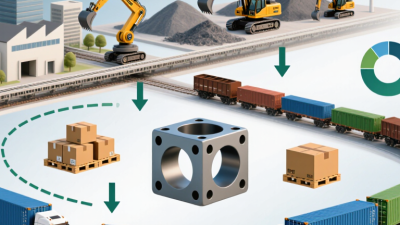
Reducing carbon in global sourcing starts with a map, not a pledge. Start with the product. Trace its materials from extraction through processing, assembly, packaging, and delivery. A cotton shirt, for example, may carry emissions from farm fertilizer, dye-house boilers, sewing-room electricity, and air freight. These stages often sit with different suppliers, sometimes several tiers away.

Record activity data where possible: kilowatt-hours used, fuel burned, material quantities, and shipment distances. Pair each figure with its source and reporting period. When suppliers cannot provide primary data, use documented estimates and mark them clearly. A spreadsheet can look exact while hiding rough assumptions. That gap deserves attention, not polish.

Map transport routes by mode, since a container ship and an urgent air shipment have very different carbon profiles. Ask suppliers how production energy is measured and whether figures cover the same facility and product. Compare like with like. The first map will be incomplete; smaller workshops and subcontractors may be hard to see. Update it as better records arrive, and flag estimates that could change purchasing decisions.

2026 Top Strategies for Reducing Carbon in Global Sourcing — Mapping Emissions Across the Supply Chain

Supply-chain stage Emissions boundary / data to map Reduction strategy Practical KPI Verified reference point
Purchased materials and supplier selection Scope 3 Category 1: purchased goods and services. Map material quantities, supplier-specific emissions data, production location, and calculation method. Prioritize high-emission materials; request product-level footprints and primary activity data; include emissions performance in sourcing decisions and supplier engagement. Share of procurement spend covered by supplier-specific emissions data; tCO₂e per unit of material. CDP reported that companies’ supply-chain emissions were, on average, 11.4 times their operational emissions in its 2020 analysis. This is a reported average, not a universal company ratio.
CDP, Transparency to Transformation (2020)
Supplier manufacturing Supplier-site fuel and process emissions, purchased electricity, production volume, and the buyer’s allocated share of output. Work with suppliers on energy efficiency, renewable electricity procurement, process heat improvements, and credible site-level transition plans. Supplier emissions intensity (tCO₂e per unit produced); renewable electricity share; annual emissions-data coverage. Use the GHG Protocol Scope 3 Standard to define boundaries and report relevant value-chain categories consistently; do not assume one reduction percentage applies to every supplier.
GHG Protocol, Scope 3 Standard
Inbound and outbound freight Scope 3 Category 4 and Category 9, as applicable. Capture shipment weight, distance, transport mode, fuel or carrier data, and load utilization. Avoid unnecessary air freight; consolidate shipments; improve load factors; optimize routes; shift suitable freight to lower-emission modes where practical. tCO₂e per tonne-kilometre; air-freight share of tonne-kilometres; average load factor; emissions by transport mode. The IEA estimated that freight transport produces about 8% of global energy-related CO₂ emissions; the figure rises to about 11% when logistics operations are included. These are global estimates, not a company-specific baseline.
IEA, The Future of Trucks
Ocean shipping Record container or cargo weight, route, vessel or service data where available, and well-to-wake or tank-to-wake accounting boundary. Improve consolidation and planning; compare lower-emission services using consistent methods; assess emerging fuels with lifecycle and availability checks. gCO₂e per tonne-kilometre; emissions per shipment; share of ocean freight with carrier-specific emissions data. International shipping accounted for approximately 2.89% of global anthropogenic CO₂ emissions in 2018, according to the IMO’s Fourth GHG Study. This is a sector-wide historical estimate.
International Maritime Organization, Fourth GHG Study (2020)
Warehousing and distribution Warehouse electricity and fuel, refrigerant leakage where relevant, facility area, throughput, and outsourced logistics activity. Improve building efficiency; procure renewable electricity; maintain refrigeration systems; reduce avoidable storage and handling through network planning. kgCO₂e per pallet handled or order shipped; electricity use per square metre; refrigerant leakage rate. The IEA’s freight estimate reaches about 11% of global energy-related CO₂ emissions when logistics operations are included. The precise boundary and coverage should be checked when comparing estimates.
IEA, The Future of Trucks
Packaging and product design Packaging material type and mass, recycled content, packaging per shipped unit, and impacts of product weight or dimensions on transport. Reduce unnecessary packaging; right-size packs; evaluate reusable or recycled-content options using lifecycle evidence and local recovery conditions. Packaging mass per product; recycled-content share; packaging-related tCO₂e per shipped unit. Calculate impacts using documented quantities and suitable emission factors; avoid treating recyclability claims alone as evidence of lower lifecycle emissions.
GHG Protocol, Scope 3 Standard
Product use and end of life Where relevant, map Scope 3 Category 11 (use of sold products) and Category 12 (end-of-life treatment), including lifetime, energy use, material composition, and disposal assumptions. Prioritize durable and repairable designs; improve product energy efficiency where applicable; design for material recovery and document end-of-life scenarios. Lifecycle tCO₂e per product; use-phase energy per year; repair or recovery rate, with boundary and calculation assumptions disclosed. The GHG Protocol identifies these as Scope 3 categories for companies whose sold products have relevant use-phase or end-of-life emissions.
GHG Protocol, Scope 3 Standard

Measurement note: The reference figures above are sector-wide or study-specific findings, not company benchmarks or guaranteed savings. Establish a year-specific baseline, disclose boundaries and emission factors, and compare like-for-like data over time.

Selecting and Engaging Lower-Carbon Suppliers

Selecting lower-carbon suppliers starts with comparable evidence, not broad promises. The GHG Protocol’s Scope 3 Standard recommends measuring value-chain emissions across relevant categories. CDP’s 2020 Global Supply Chain Report found supplier emissions averaged 11.4 times buyers’ direct operational emissions. That gap makes purchasing decisions important.

Ask shortlisted suppliers for product-level emissions, energy sources, calculation boundaries, and reduction plans. Compare emissions per unit, not totals alone; a larger supplier may produce more but have a lower footprint per component. Check whether data is measured, estimated, or independently verified. A polished scorecard can still hide weak assumptions. I would not treat it as truth.

Engagement matters as much as selection. Set practical milestones, such as reporting energy use quarterly or replacing high-carbon process heat where feasible. Offer clear templates and technical support, especially to smaller suppliers with limited reporting capacity. Small steps matter. Track progress against a baseline, and discuss missed targets before removing a supplier from consideration. The CDP report also highlights the value of supplier collaboration: buyers that engage suppliers can identify reduction opportunities beyond their own facilities. Some data will remain incomplete at first; record the uncertainty and improve it over time.

Applying Carbon Reduction Strategies in Procurement

Applying carbon reduction strategies in procurement starts with visibility.

The CDP Global Supply Chain Report 2021 found that companies’ supply-chain emissions averaged 11.4 times their operational emissions.

That gap matters. Buyers should map emissions by material, supplier, and transport route, then request activity data rather than relying only on broad estimates.

A shipment’s weight, distance, and mode can reveal practical changes, such as consolidating part-load deliveries or shifting suitable freight from air to sea.

Procurement teams can also embed carbon criteria in specifications and supplier reviews. Ask for product-level emissions, energy sources, and improvement plans; prioritize high-impact inputs such as steel, chemicals, and packaging.

The World Resources Institute and World Business Council for Sustainable Development’s Greenhouse Gas Protocol identifies purchased goods and services as a Scope 3 category, making purchasing decisions central to credible accounting.

Start with data. But data quality varies, and smaller suppliers may lack measurement tools. Provide simple templates, allow time for improvements, and verify estimates where feasible.

A lower quoted footprint is not automatically a lower real footprint. Price, durability, and delivery constraints still matter, and procurement teams should record trade-offs instead of treating every target as easy.

Measuring Progress and Improving Sourcing Performance

Reducing carbon in global sourcing starts with measuring performance where purchasing decisions are made. Track emissions per unit, total purchased volume, transport mode, and data coverage for each major category. Keep the boundaries consistent. A lower per-unit figure can hide rising total emissions when order volumes grow. Record the baseline year, calculation method, and whether each figure is measured or estimated. That distinction matters. For example, compare emissions from a shipment of 20 pallets by air with an equivalent sea shipment, while noting differences in delivery time and load size.

Review supplier data quarterly, but assess more than carbon figures. Pair emissions trends with quality, delivery reliability, and defect rates to see whether improvements hold up in daily operations. A supplier using cleaner electricity may show progress, while incomplete energy records make that result harder to verify. We may still be comparing imperfect estimates; that uncertainty should be visible, not buried. Ask suppliers to explain large changes and share supporting records, such as meter readings or freight documents. Set practical targets, then revisit them when product specifications or sourcing volumes change. A metric is useful only when teams can act on it.